This section presents data based on the following observations.
※ This site shows the trend of long-term changes (red line in the figure) along with the observed values.
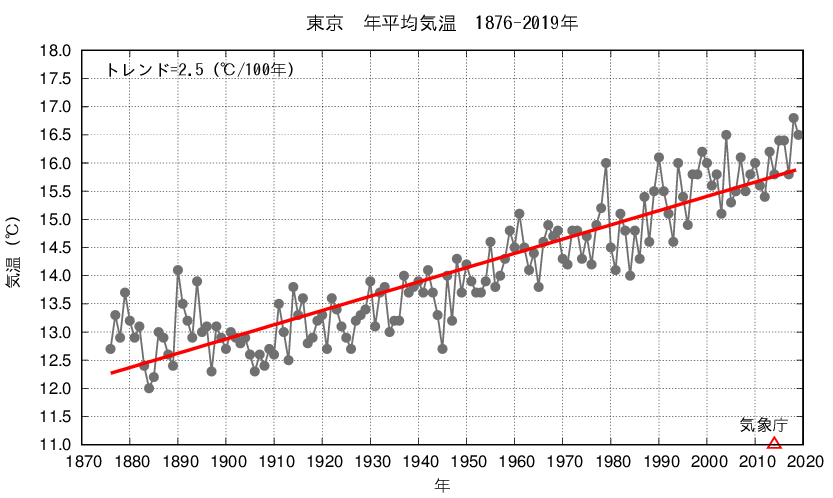
The graph shows the annual average temperature over time in the past.
Assessment of long-term trends: Increased (statistically significant at 99% confidence level)
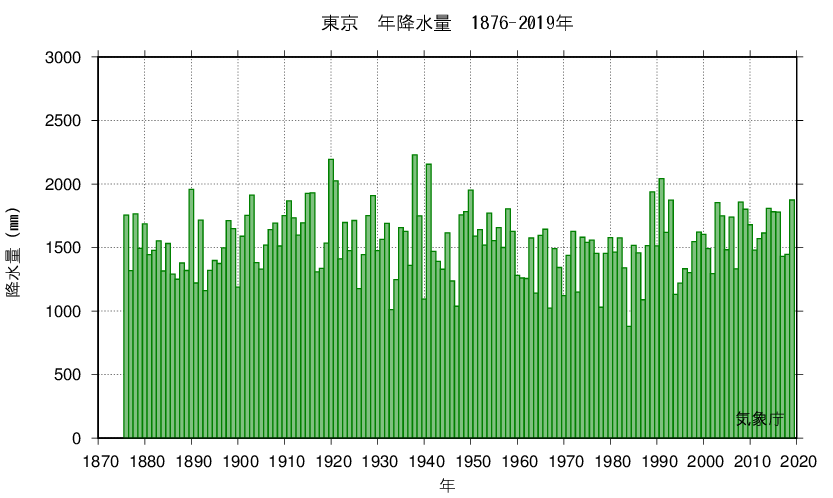
The graph shows the annual changes in precipitation in the past.
Evaluation of long-term trends: No trends
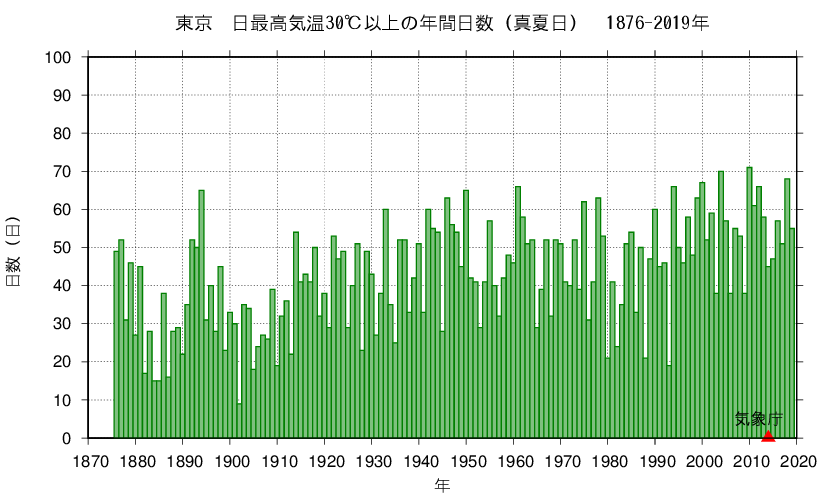
The graph shows the annual variation in the number of days of the year when the daily maximum temperature is 30°C or higher (midsummer day).
Evaluation of Long-Term Change Trends: Because data are not homogeneous within a statistical period, long-term trends cannot be assessed.
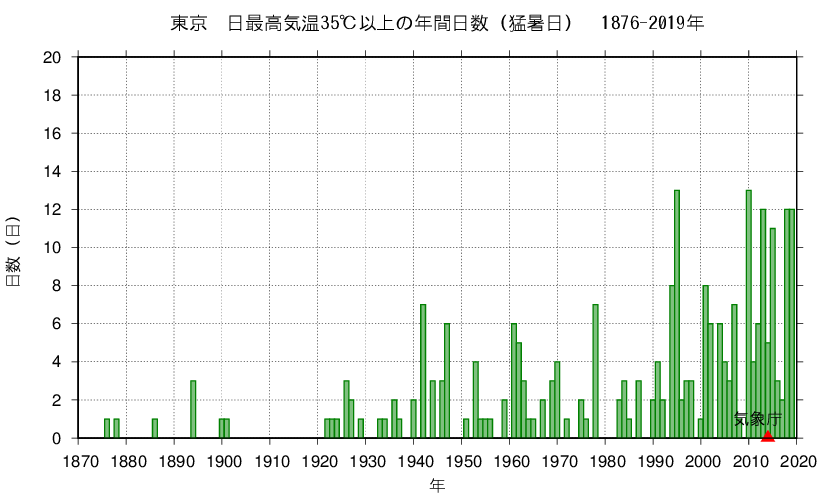
The graph shows the change over time in the number of days per year with a maximum daily temperature of 35°C or more (Extremely hot day).
Evaluation of Long-Term Change Trends: Because data are not homogeneous within a statistical period, long-term trends cannot be assessed.
