This section presents data based on the following observations.
※ This site shows the trend of long-term changes (red line in the figure) along with the observed values.
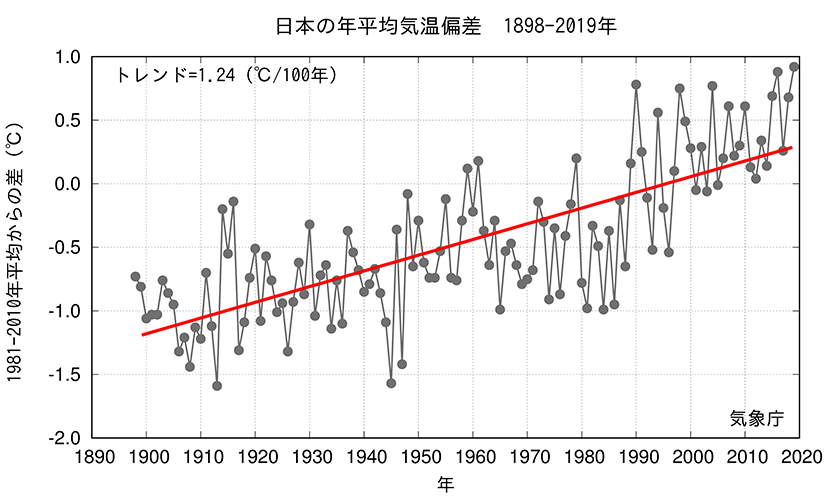
The graph shows the annual average temperature deviation over time across the country.
Assessment of long-term trends: Increased (statistically significant at 99% confidence level)
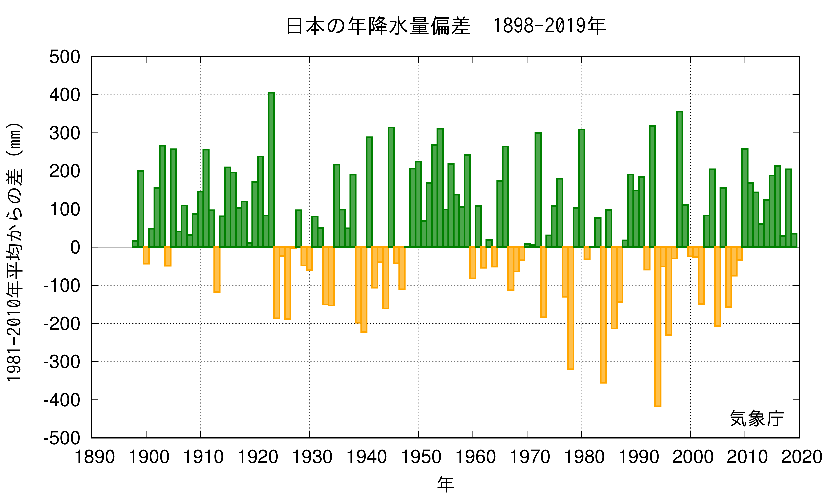
The graph shows the aging of the past annual precipitation deviations across the country.
Evaluation of long-term trends: No trends
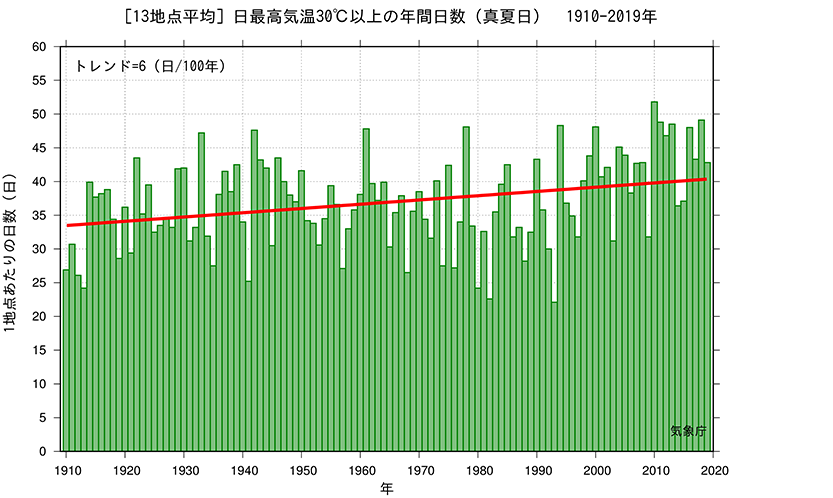
The graph shows the change over time in the number of days per year for the maximum daily temperature of 30°C or more (mid-summer day) nationwide.
Evaluation of long-term trends: Increased trends (statistically significant at 95% confidence level)
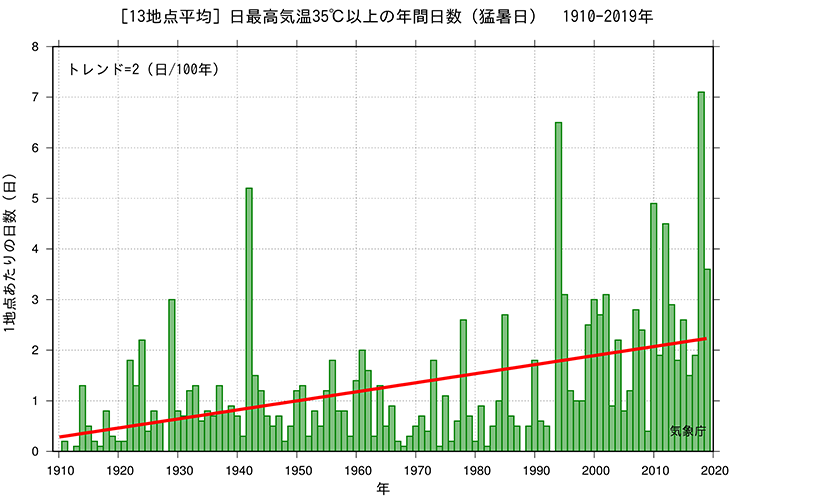
The graph shows the annual change in the number of days at the maximum .daily temperature of 35°C or more (Extremely hot day) nationwide.
Assessment of long-term trends: Increased (statistically significant at 99% confidence level)
