Notes
(*1) A 3D viewer that can rapidly generate a vast 3D space consisting of high-density, high-definition DEM data acquired by mapping and laser measurement and high-resolution ortho-images. Anyone can easily experience the 3D space using the on-screen operation controller.
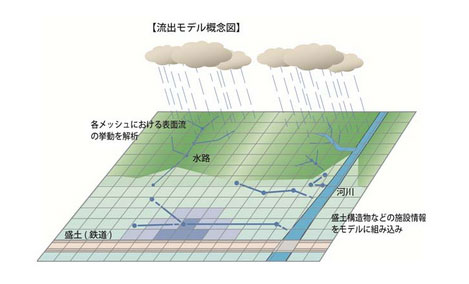
(*2) An analytical model in which the watershed to be analyzed is divided into meshes, each mesh representing watershed characteristics such as ground elevation and land use conditions.
Development of 3D Inundation Hazard Map
Asia Air Survey Co., Ltd.
Industry: Academic research, professional and technical services
| Publication date | March 31, 2023 (Posted on December 25, 2023) |
|---|---|
| Sector | Natural Disasters and Coastal Areas |
Company Overview
Asia Air Survey Co., Ltd. is a company that provides consulting services for disaster prevention, environment, and social infrastructure based on spatial information, including measurement and information dissemination following the occurrence of natural disasters, conservation and cultivation of forests and other natural environmental resources, entry into renewable energy business, and planning and design of social infrastructure facilities.
Climate Change Impacts
In recent years, various issues such as climate change, biodiversity, response to natural disasters, and social infrastructure maintenance and management have become more prominent within and outside of Japan. In 2020, combined disasters such as widespread floods and landslides in the Kyushu and Chubu regions had a major impact on society and the natural environment.
Adaptation Initiatives
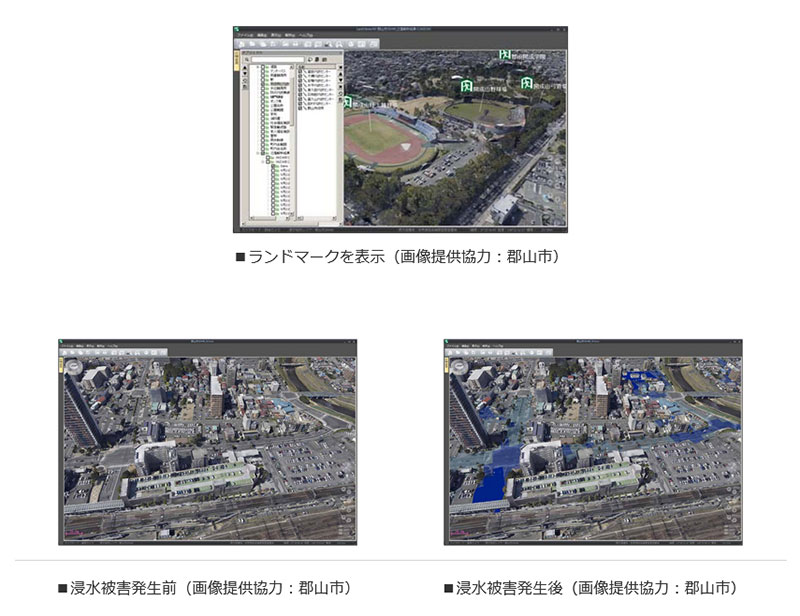
We developed a "3D Inundation Hazard Map" that overlays 3D hazard information with a 3D building model with realistic photo textures, in order to provide risk information that is easy to understand. This includes information such as how far an individual’s house will be inundated and which building to evacuate to in the event of a vertical evacuation, which cannot be identified with conventional 2D hazard maps.
The 3D Inundation Hazard Map is created by superimposing the data of "various landmarks (evacuation sites and other major facilities such as roads)," "3D urban city models," and "results of inundation analysis" on the base software of "LandViewer NX" (*1), a highly accurate 3D viewer that we developed (Fig. 1).
- Data acquisition of various landmarks
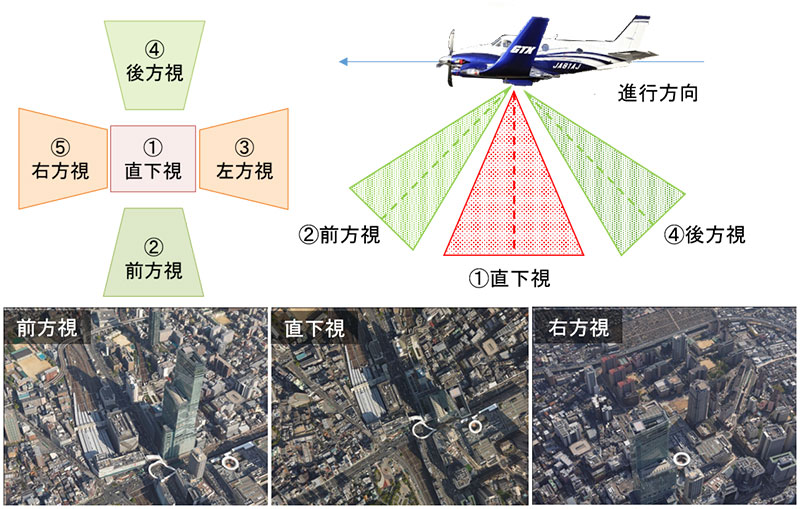
Using the latest aerial survey camera, the Oblique Aerial Camera, nadir and four oblique view (forward, backward, leftward, and rightward) images are simultaneously taken in a single shot (Fig. 2). The use of oblique view images enables acquisition of 3D spatial information such as building sides. - 3D urban city models
Realistic replication of real space in 3D by employing a multi-view stereo method that automatically extracts pixel feature points from multiple photographs to create a 3D model. - Results of inundation analysis
An inundation analysis was conducted utilizing a distributed runoff model (*2). Rainfall data was added to this analytical model to reproduce the surface flow of the watershed during rainfall in detail (Fig. 3). We further improved the accuracy of the surface flow analysis by utilizing microtopographic information obtained from aerial laser measurements. This analysis method is particularly effective for understanding local inundation characteristics (inundation area, inundation depth, inundation time, etc.) caused by torrential rains.
The 3D inundation hazard map created by this project is being used in Koriyama City, Fukushima Prefecture, and a 3D animation of major points in the city created using LandViewer NX is available on the city's website for local residents.
Effects / Expected Benefits
Conventional inundation hazard maps generally superimpose the results of inundation analysis and information on evacuation sites on top of two-dimensional topographic maps and aerial photographs. The 3D Inundation Hazard Map allows the user to switch the time line and check the status of damage (flooding under the floor, flooding above the floor, etc.) from any perspective. Since it is possible to check flood damage over time, the maps can also be used as reference material for evacuation plans.
Related sites
- Asia Air Survey Co., Ltd.
- Asia Air Survey Co., Ltd. "3D Inundation Hazard Map"(only available in Japanese)
- Asia Air Survey Co., Ltd. "LandViewer NX"(only available in Japanese)
- Asia Air Survey Co., Ltd. "Technical Report For the Future 2022 3D Urban Modeling and Municipal Deployment"(only available in Japanese)
