Climate change impacts
The heat island effect, as a consequence of dense urbanization, is a significant issue for the ‘kyūtokenshi’ area (see Note), and the number of hospitalizations from heat stroke is increasing year on year. The impact of climate change is expected to further increase this health hazard.
(Note) kyūtokenshi collectively refers to the Saitama Prefecture, Chiba Prefecture, Tokyo, Kanagawa Prefecture, Yokohama City, Kawasaki City, Chiba City, Saitama City, Sagamihara City
Adaptation activity
The Environmental Management Committee of the National Capital Region Nine Government Summit Council organized seven promotional events in the summer of FY 2018 in which they distributed parasols for public use. The Ministry of the Environment conducted a study on how the measurement and presentation to the public of heat stress index data (Wet Bulb Globe Temperature, WBGT) impacted the use of parasols at three of the events.
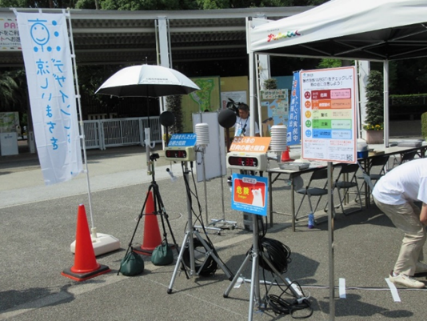
Parasols were loaned to visitors at the entrances of three venues; the Yokohama municipal Zoo Zoorasia, the Chiba Zoological Park, and the Inokashira Park Zoo. Real-time WBGT readings for direct sunlight and from under the protection parasols were also displayed (Fig. 1) in order to publicize the effectiveness of the parasols.
Outputs / Expected benefits
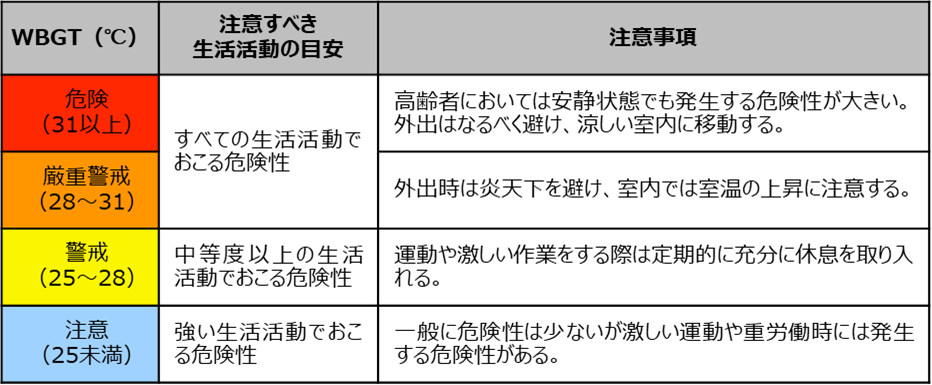
WBGT was reduced by 1 to 3℃ through the use of parasols, compared to being in direct sunlight. For example, at the Chiba Zoological Park site, parasol use reduced measured WBGT by 3°C and a decrease in one warning level of heat stroke (see table) (Fig. 2).
It is also expected that the presentation of the efficacy of heat mitigation will promote better understanding of heat stroke issues and greater uptake of heat countermeasures. In this research the percentage of parasol use (number of subjects who borrowed parasols vs the total number of people who passed through the parasol rental area) tended to be higher when the WBGT data was displayed, compared to when it was not. The average usage rate without WBGT display was 27.0%, whereas the rate with WBGT display was 33.5%, i.e. an increase of over 6%. By expressing the effects of heat and countermeasures in real-time numerical values, and using for them as public relations material, it is thought that the use of heat countermeasures can be more successfully promoted.