Climate change impacts
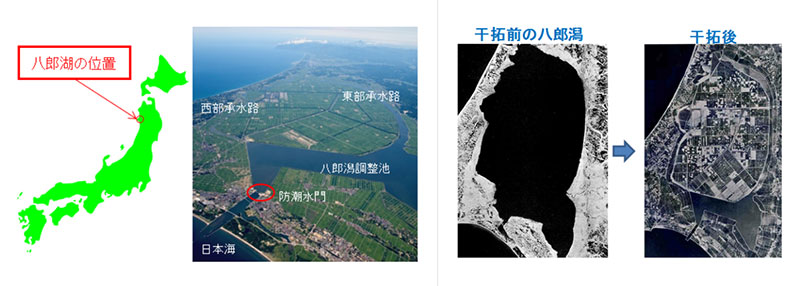
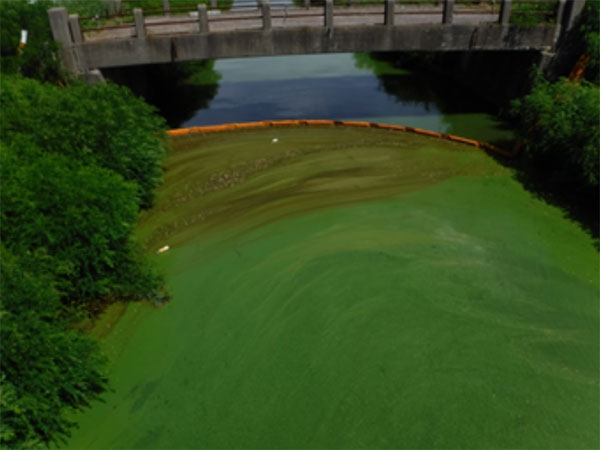
To prevent saltwater intrusion from the Sea of Japan, a tide gate has been installed as part of a land reclamation project in the Funakoshi Waterway of Lake Hachirō (Fig. 1), which is at the base of the Oga Peninsula in the central western part of Akita Prefecture. Eutrophication (see Note 1) has been gradually increasing, and in recent years, the problem of water pollution has become evident, with the generation of large quantities of blue-green algae (aoko) (see Note 2).
From a 30 year (FY1981-FY2007) nationwide study of temperature change in public water sources (rivers, lakes, marshes, and oceans) by the Ministry of the Environment, upward trends were observed in 72% of 4,477 observation points during the summer, and 82% in winter, with higher water temperatures indicating associated changes in water quality (see Note 3). While some studies suggest that changes in water temperature are not necessarily the result of climate change, other reports have shown a greater incidence of blue-green algae when the annual average temperature exceeds 10°C.
Adaptation activity
Akita Prefecture has established "Our Lake with Blessings and Enrichment" as its long-term vision for the desirable water environment of Lake Hachiro and the future of the basin, and has been formulating a lake water quality conservation plan since 2007. The first stage of the plan (FY2007-FY2012) focused on reducing the burden on the lake from pollution sources such as domestic, industrial and commercial wastewater, and turbid water from agricultural runoff. The Second stage (FY2013-FY2018) focused on measures for maintaining water quality in the lake and ameliorating the impact on local residents of offensive odors caused by blue-green algae. Currently, the third stage, for the period FY 2019-2024, aims to set targets for water quality and pollutant load in terms of chemical oxygen demand (COD) (see Note 4) which indicates pollution status, and also total nitrogen (see Note 5) and phosphorus (see Note 6) content, which serve as indicators for eutrophication. To this end, in addition to projects and regulations aimed at maintaining water quality, the monitoring of public water is also called for. Water quality is regularly monitored and measured in designated areas. Also, with a view of protecting the ecosystem, aspects of water quality such as Dissolved Oxygen(DO)(see Note 7), transparency, and Total Organic Carbon (TOC) are recorded (see Note 8).
Outputs / Expected benefits
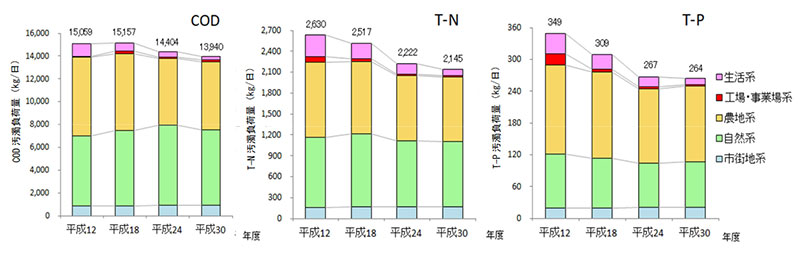
In the first stage, there has been some success in reducing pollution, such as sewage management for wastewater draining into the lake basin reaching 90%, and the amount of pollution from agricultural activity also being reduced, with the extension of more effective water drainage for over 90% of paddy fields. In the lake’s western canal (Fig. 1), which was extremely polluted from having limited through flow, water quality was improved by increasing the amount of water in the canal and enhancing water flow. In the second stage, the pollution load on the lake was reduced to a certain extent by more efficient fertilization of 95% of paddy fields which helps reduce fertilizer runoff. In addition, a long-term foundation for improving water quality was established by using the natural and sustainable purifying action of native flora and verifying the resulting high-concentration of oxygen in the water and sediment. Some success has also been achieved in the reduction of offensive odors caused by blue-green algae by increasing the number of silt fences (Fig. 2) to prevent algae moving up river, and the installation of control devices and surveillance cameras. As a result of these measures, the pollutant load of COD and other substances flowing into Lake Hachirō have been reduced (Fig. 3).
Footnote
(Note 1) Eutrophication is a phenomenon in which the concentration of minerals such as nitrogen and phosphorus increases. In eutrophication, phytoplankton grows abnormally, resulting in an increase in blue-green algae.
(Note 2) Blue-green algae (aoko), a type of phytoplankton, can be seen in large blooms on the surface of lakes and ponds in the form of a green particulate mass. It is found in bodies of freshwater that are rich in nitrogen and phosphorus (eutrophic), and grow in Lake Hachirō in the summer.
(Note 3) Ministry of Education, Culture, Sports, Science and Technology, Ministry of the Environment "Japanese Climate Change and Its Impacts" (FY2012 Version): An Integrated Report on Observation, Projection, and Impact Assessment of Climate Change
(https://www.env.go.jp/earth/ondanka/rep130412/report_full.pdf)
(Note 4) COD (Chemical Oxygen Demand) represents the amount of oxygen consumed in the chemical decomposition of organic matter in water by an oxidizing agent. It can be taken as an index of the pollution status of water in lakes and marshes. The higher the value, the more polluted the water is with organic matter.
(Note 5) Total nitrogen (T-N) is used as an indicator of water pollution, and refers to the sum of organic and inorganic nitrogen. Nitrogen is essential for the growth of phytoplankton and, together with phosphorus, is a nutrient salt, and its concentration is used as a measure of eutrophication in lakes and marshes.
(Note 6) Total phosphorus (T-P) is used as an indicator of water pollution, and refers to the sum of organic phosphorus and inorganic phosphorus.
(Note 7) DO (Dissolved Oxygen) refers to the amount of oxygen dissolved in water. The higher the amount of oxygen consumed by microorganisms, the lower the amount of dissolved oxygen. While cleaner water contains more dissolved oxygen, water can become supersaturated with steep temperature rises or when there are significant algae blooms.
(Note 8) TOC (Total Organic Carbon) is an indicator of water quality that shows the total amount of organic material that can be oxidized in water in terms of the amount of carbon.