Footnote
(Note 1) “Risk management information center (RIC24: Rescuenow Information Center 24)” operated by Rescuenow, continues to monitor, collect and distribute information non-stop around the clock, throughout the year. It also provides real-time updates on emergencies that occur during night time or on holidays.
(Note 2) Ministry of Land, Infrastructure, Transport and Tourism- Japan Meteorological Agency Website “Designated River Flood Forecasts”
https://www.jma.go.jp/jma/kishou/know/bosai/flood.html
Real-Time Disaster Information Mapping Service: “Rescue Web MAP”
Rescuenow Inc.
Industry: Information and communications
| Publication date | September 15, 2022 (Posted on May 17, 2023) |
|---|---|
| Sector | Natural Disasters / Coastal Areas / Industrial and economic activities |
Company Overview
Rescuenow Inc. is engaged in content business that provides risk management information distribution services for disasters, traffic, and weather. We also plan, produce and sell extensive products and disaster prevention stock supplies to support the preparation and training for the initial response in emergency situations making use of our proprietary collected information for disaster response.
Climate Change Impacts
Japan is a country of many natural disasters including floods, earthquakes and heavy snowfall. How to protect people from disasters is one of the most important issues from the perspectives of SDGs and ESG. In particular, disasters caused by climate change, such as torrential rains, have recently become a major issue, and accurately grasping the constantly changing information is important to promote risk management measures and to minimize damage.
Adaptation Initiatives
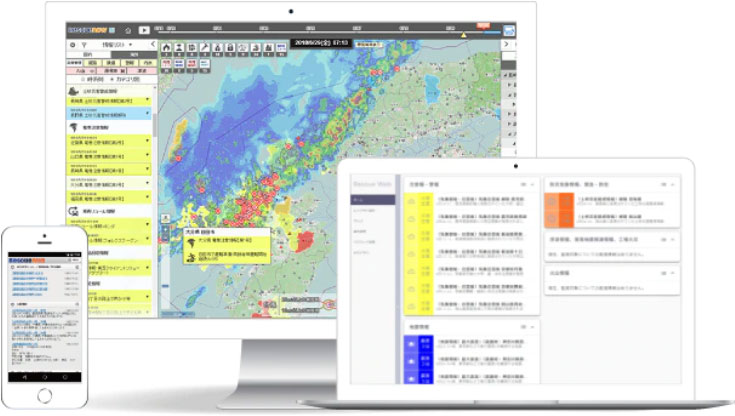
“Rescue Web MAP” is a cloud service that displays real time disaster, traffic, and lifeline information, that we collect around the clock, throughout the year, on a map that shows our customers and their business partners (Fig. 1).
When a disaster or a crisis occurs, the service alerts the users, enabling them to comprehensively grasp the risks of earthquakes, river flooding, and inundation damage, including the operational status of lifelines, and automatically identifies the affected location in the area, consolidating the information necessary for the initial response.
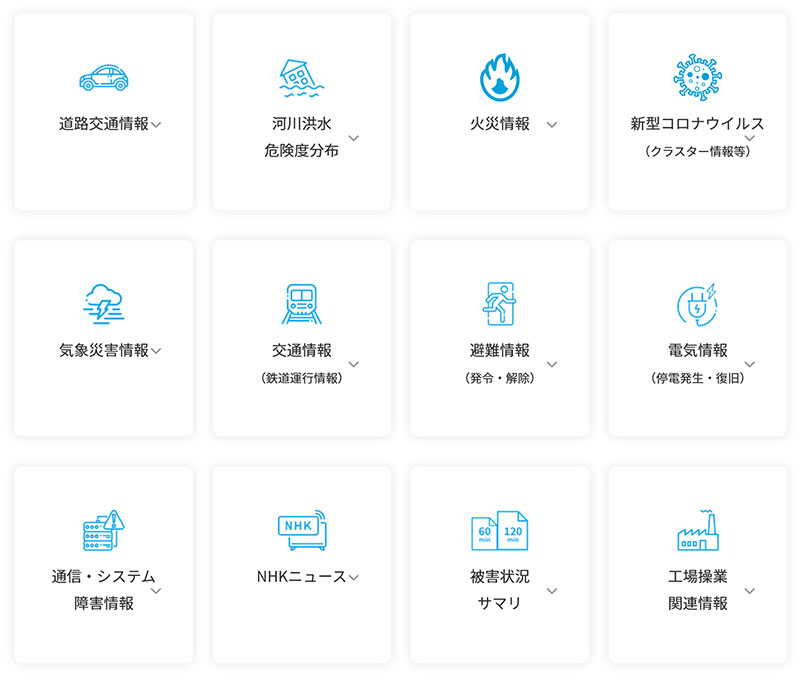
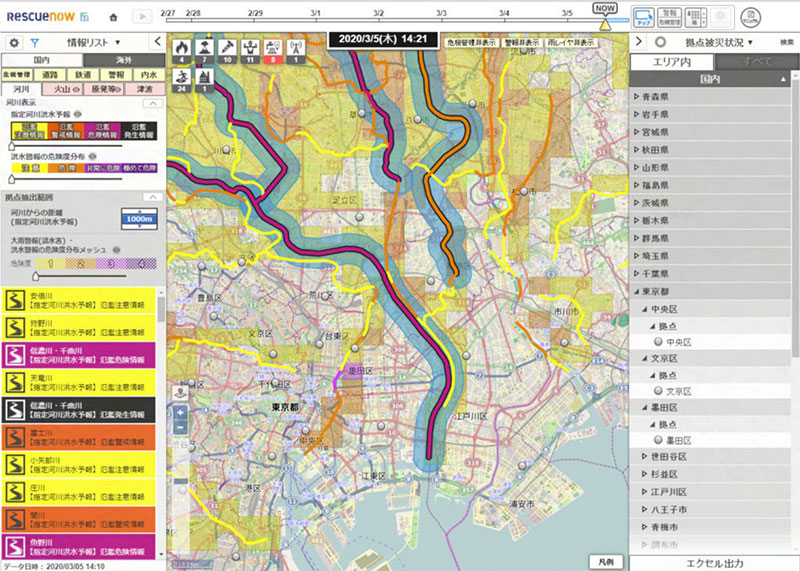
The data regarding the distributed information (Fig. 2) will be constantly monitored and collected by our risk management information center (Note 1) from the moment a disaster occurred to the end of it, and “Rescue Web MAP” will display the scope, scale, and outline of the crisis on a map in real time, using a color scheme (Note 2) that corresponds to the color scheme rules used by the Cabinet Office and Japan Meteorological Agency. (Fig. 3).
By registering the user's offices or affiliated factories in advance, the system can also automatically list the affected locations together with the latest information on the “Rescue Web MAP”. In doing so, it is possible to narrow down the disaster/crisis information by category and level, and to check the progress back in time (up to one week in advance with the time sliding function). The system can also be linked to the operational data of the user's stores and facilities. For example, when it is linked to the weather sensor installed at each location, the data for wind direction/speed acquired from the sensors can be used to make decisions on handling outdoor materials or equipment. When linked to the POS cash register at a retail store, it can be used as one of the criteria for business continuity, for example, if the cash register is still in operation, it could indicate that the damage is small and the store can continue its operation.
The main functions displayed in “Rescue Web MAP” are as follows.
| Disaster Type | Main Functions |
|---|---|
| Warning | Emergency warnings, warnings, and advisories issued by the Japan Meteorological Agency are color-coded on the map. Emergency warnings and warnings are also displayed as icons. |
| Floods and inundation (rivers) | Color-coded by danger level based on Designated River Flood Forecasts, Warning for Flood, and Warning for Heavy Rain (Flooding Damage) and Danger Distribution (Integrated Version) published by the Japan Meteorological Agency. |
| Sediment-related disaster | Warning for Heavy Rain (Landslide Disaster) Danger Distribution provided by the Japan Meteorological Agency by 1 km mesh. |
| Typhoon | Color-coded mesh shows the probability of typhoons moving into the developing storm area every 3 hours, from 1 to 5 days in advance. |
| Earthquake | Color-coded display of seismic intensity by city/town/village when an earthquake of intensity 3 or higher occurs. Display can be narrowed down by seismic intensity. |
| Eruption | Color-coded display of eruption warning levels issued by the Japan Meteorological Agency for each city, ward, town and village. Displays up to three circles around the volcano (up to 100 km in 1km units) |
| Tsunami | Mesh display of areas below a specified elevation (up to 40 meters in 1m units) |
Effects / Expected Benefits
By using “Rescue Web MAP”, the users can visually capture information and impact from various sources, which leads to rapid responses, including collecting necessary risk information, analyzing the impact, and reporting to the management team.
For example, when identifying locations with the possibility of river flooding or inundation due to heavy rain, the task of checking the constantly changing information released by the Japan Meteorological Agency and local governments, and looking up the list of related addresses for the company and its business partners can now be instantly done with “Rescue Web MAP”.
In this way, the time previously consumed to assess the impact on the company's sites and supply chain can be significantly reduced.
Related sites
