Notes
(*1) For small and medium-sized rivers, the river channel data necessary to study the expected inundation area is rarely available for the entire section, so the data that can be used for inundation analysis is limited and yet there are so many rives, requiring significant cost and labor.
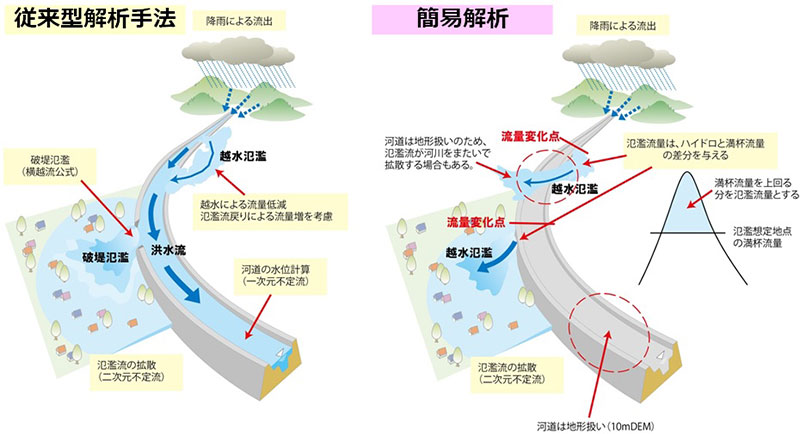
(*2) The ground data is set to a 10-meter mesh, which is more precise than the 25-meter mesh of the conventional method, to accurately represent the difference in elevation between the inner and outer areas of the embankment, road embankments, and other local features, and to visualize the occurrence of flooding caused by the topography. Furthermore, at the border areas of rivers that have experienced flood damage in recent years or existing flood inundation zones, the inundation area/depth information are used to verify the accuracy of the simplified assumed inundation zones.
(*3) Inundation analysis tools are used to reproduce and predict inundation phenomena caused by river flooding, rainfall and runoff. The simplified method presented here calculates the extent and depth of inundation using two-dimensional indeterminate flow calculations for the floodplain, without considering the influence of flow conditions in the river channel or drainage facilities.
(*4) Geographic Information System (GIS) is a technology that comprehensively manages, processes, and visually displays data with location-related information (spatial data) using geographic location, enabling advanced analysis and rapid decision-making. (Geospatial Information Authority of Japan, "What is GIS..." (From https://www.gsi.go.jp/GIS/whatisgis.html)
(* 5) Conventional assumed inundation zones for rivers with high flooding risk, are examined through integrated inundation analysis of river channels and floodplains, using river channel cross-sectional data based on actual measurements and elevation data of land within embankments.
Development of a Simplified Flood Risk Assessment Method
Asia Air Survey Co., Ltd.
| Publication date | March 31, 2023 (Posted on December 25, 2023) |
|---|---|
| Sector | Natural Disasters and Coastal Areas |
Company Overview
Asia Air Survey Co., Ltd. is a company that provides consulting services for disaster prevention, environment, and social infrastructure based on spatial information, including measurement and information dissemination following the occurrence of natural disasters, conservation and cultivation of forests and other natural environmental resources, entry into renewable energy business, and planning and design of social infrastructure facilities.
Climate Change Impacts
In recent years, typhoons and torrential rains have caused numerous flood disasters in many parts of Japan on a scale larger than expected, and extensive inundation damage has been reported. In the future, as climate change progresses, the severity of these flood disasters and inundation damage may increase. While flood inundation zones have been published for rivers that are expected to cause extensive flood damage and the dangers of flooding are becoming more widely known, flood inundation zones have not been studied or published for many small and medium-sized rivers managed by prefectural governments (*1), and this information, which is important for local residents when making evacuation decisions, has not been disseminated.
Adaptation Initiatives
In order to facilitate smooth and prompt evacuation actions in the event of flooding, it is necessary to promptly formulate and disseminate flood risk information for small and medium-sized rivers, including the extent of expected inundation, depth of inundation, duration of inundation, and risk of house collapse in the event of heavy rainfall.
To meet this need, we acquired the ground data (*2) of river channels and land within embankments using aerial laser measurements, and developed a simple method to estimate the level of inundation using this data (Fig. 1). Based on this method, we also created a "Flood Risk Information Map" that shows the extent and depth of inundation.
The developed method reduces the number of cases for inundation analysis by narrowing down the flooding potential only to those points that have a large impact on the inundation area, based on "flow change points," "cross-river channel topography," "flat topography of the river such as mountains," "distribution of houses," "ease and impact of inundation". In addition, by combining the inundation analysis tool (*3) and GIS (*4), the input elevation for inundation analysis and the output inundation depth will be organized as mesh information including coordinate values to streamline the process from analysis to the display of analysis results.
The Flood Risk Information Map divides the areas based on the information used for river maintenance, basic rainfall [L1] and the assumed maximum rainfall [L2], and shows the likelihood of inundation in each case (Figs. 2 and 3). Since the maps are expected to be used for evacuation and local disaster prevention plans, the ranks of inundation depths and color schemes are the same as those used in hazard maps and other inundation assumption area map. The Map also includes simple explanations of the analytical conditions, such as rainfall and ground data, and the different approaches to evaluate inundation areas comparing with inundation assumption area maps that are already published.
In 2019, Gifu Prefecture published a Flood Risk Information Map for almost all sections of the 422 rivers it manages, making it the first case in Japan to highly "visualize" the flooding risk of small and medium-sized rivers.
Effects / Expected Benefits
The Flood Risk Information Map shows the depth and extent of inundation, and although the information is more limited than inundation assumption area maps, which includes the duration of inundation, it can be created in a shorter time than the conventional method (*5), and is expected to be an effective resource to understand the risk and impact of flooding. We will continue to make improvements to the simplified inundation assumption method to support the development of flood damage risk information according to river conditions, and contribute to the prevention and mitigation of flood damage.
![Example of Flood Risk Information Map at basic scale [L1] (Tsubo River, Gifu Prefecture)](img/132/img02.jpg)
(Source: Gifu Prefecture inundation assumption zone and flood hazard information map https://www.pref.gifu.lg.jp/page/20630.html)
![Example of Flood Risk Map at assumed maximum scale [L2] (Tsubo River, Gifu Prefecture)](img/132/img03.jpg)
(Source: Gifu Prefecture inundation assumption zone and flood hazard information map https://www.pref.gifu.lg.jp/page/20630.html)
